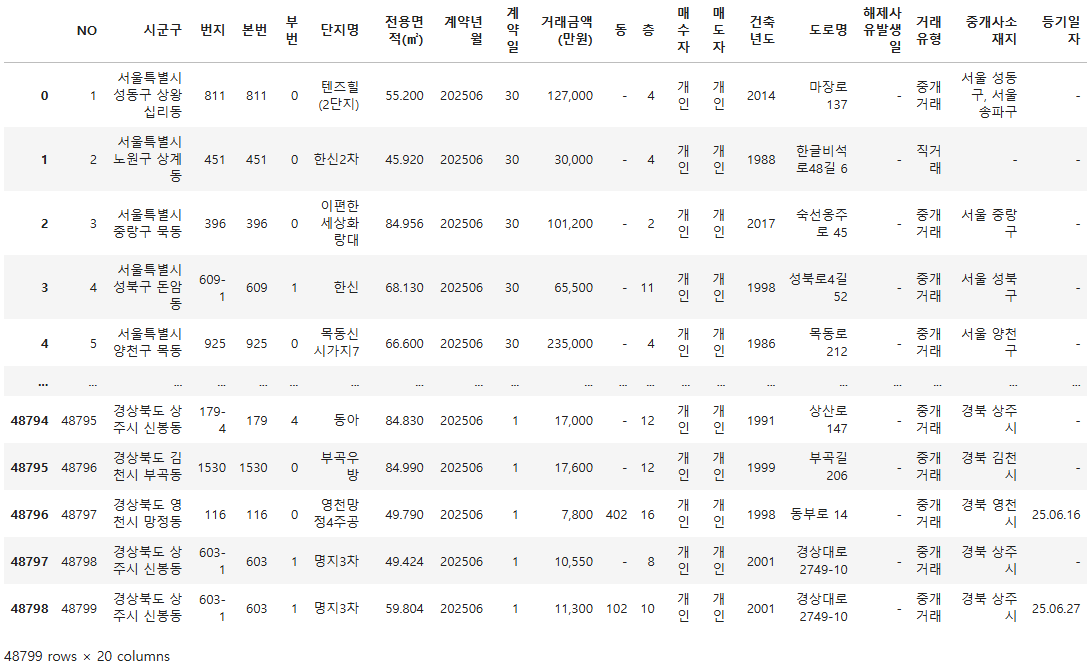
# Drop unnecessary columns
df=df.drop(columns=["NO","번지","본번","부번","단지명","동","층","도로명","중개사소재지","등기일자",])
df.describe()
전용면적(㎡)
계약년월
계약일
건축년도
count
48799.000000
48799.0
48799.000000
48799.000000
mean
76.164064
202506.0
15.002275
2006.256173
std
22.983061
0.0
8.064604
10.965883
min
9.260000
202506.0
1.000000
1962.000000
25%
59.895950
202506.0
8.000000
1997.000000
50%
83.250000
202506.0
14.000000
2006.000000
75%
84.960000
202506.0
21.000000
2017.000000
max
273.940000
202506.0
30.000000
2025.000000
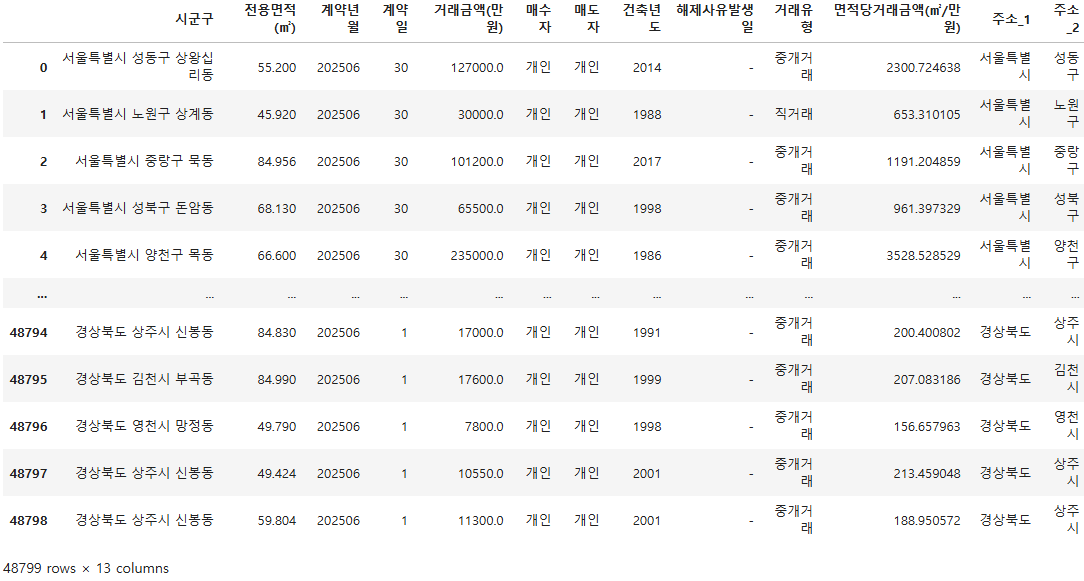
# Remove commas from '거래금액(만원)' and convert to float
df["거래금액(만원)"]=df["거래금액(만원)"].str.replace(",","")df["거래금액(만원)"]=df["거래금액(만원)"].astype(float)# Create new column '면적당거래금액(㎡/만원)'
df["면적당거래금액(㎡/만원)"]=df["거래금액(만원)"]/df["전용면적(㎡)"]
# Split the address into words and store the first two in separate columns for geojson matching
df[["주소_1","주소_2"]]=df["시군구"].str.split().str[:2].apply(pd.Series)df["주소_1"]=df["주소_1"].replace("전북특별자치도","전라북도")